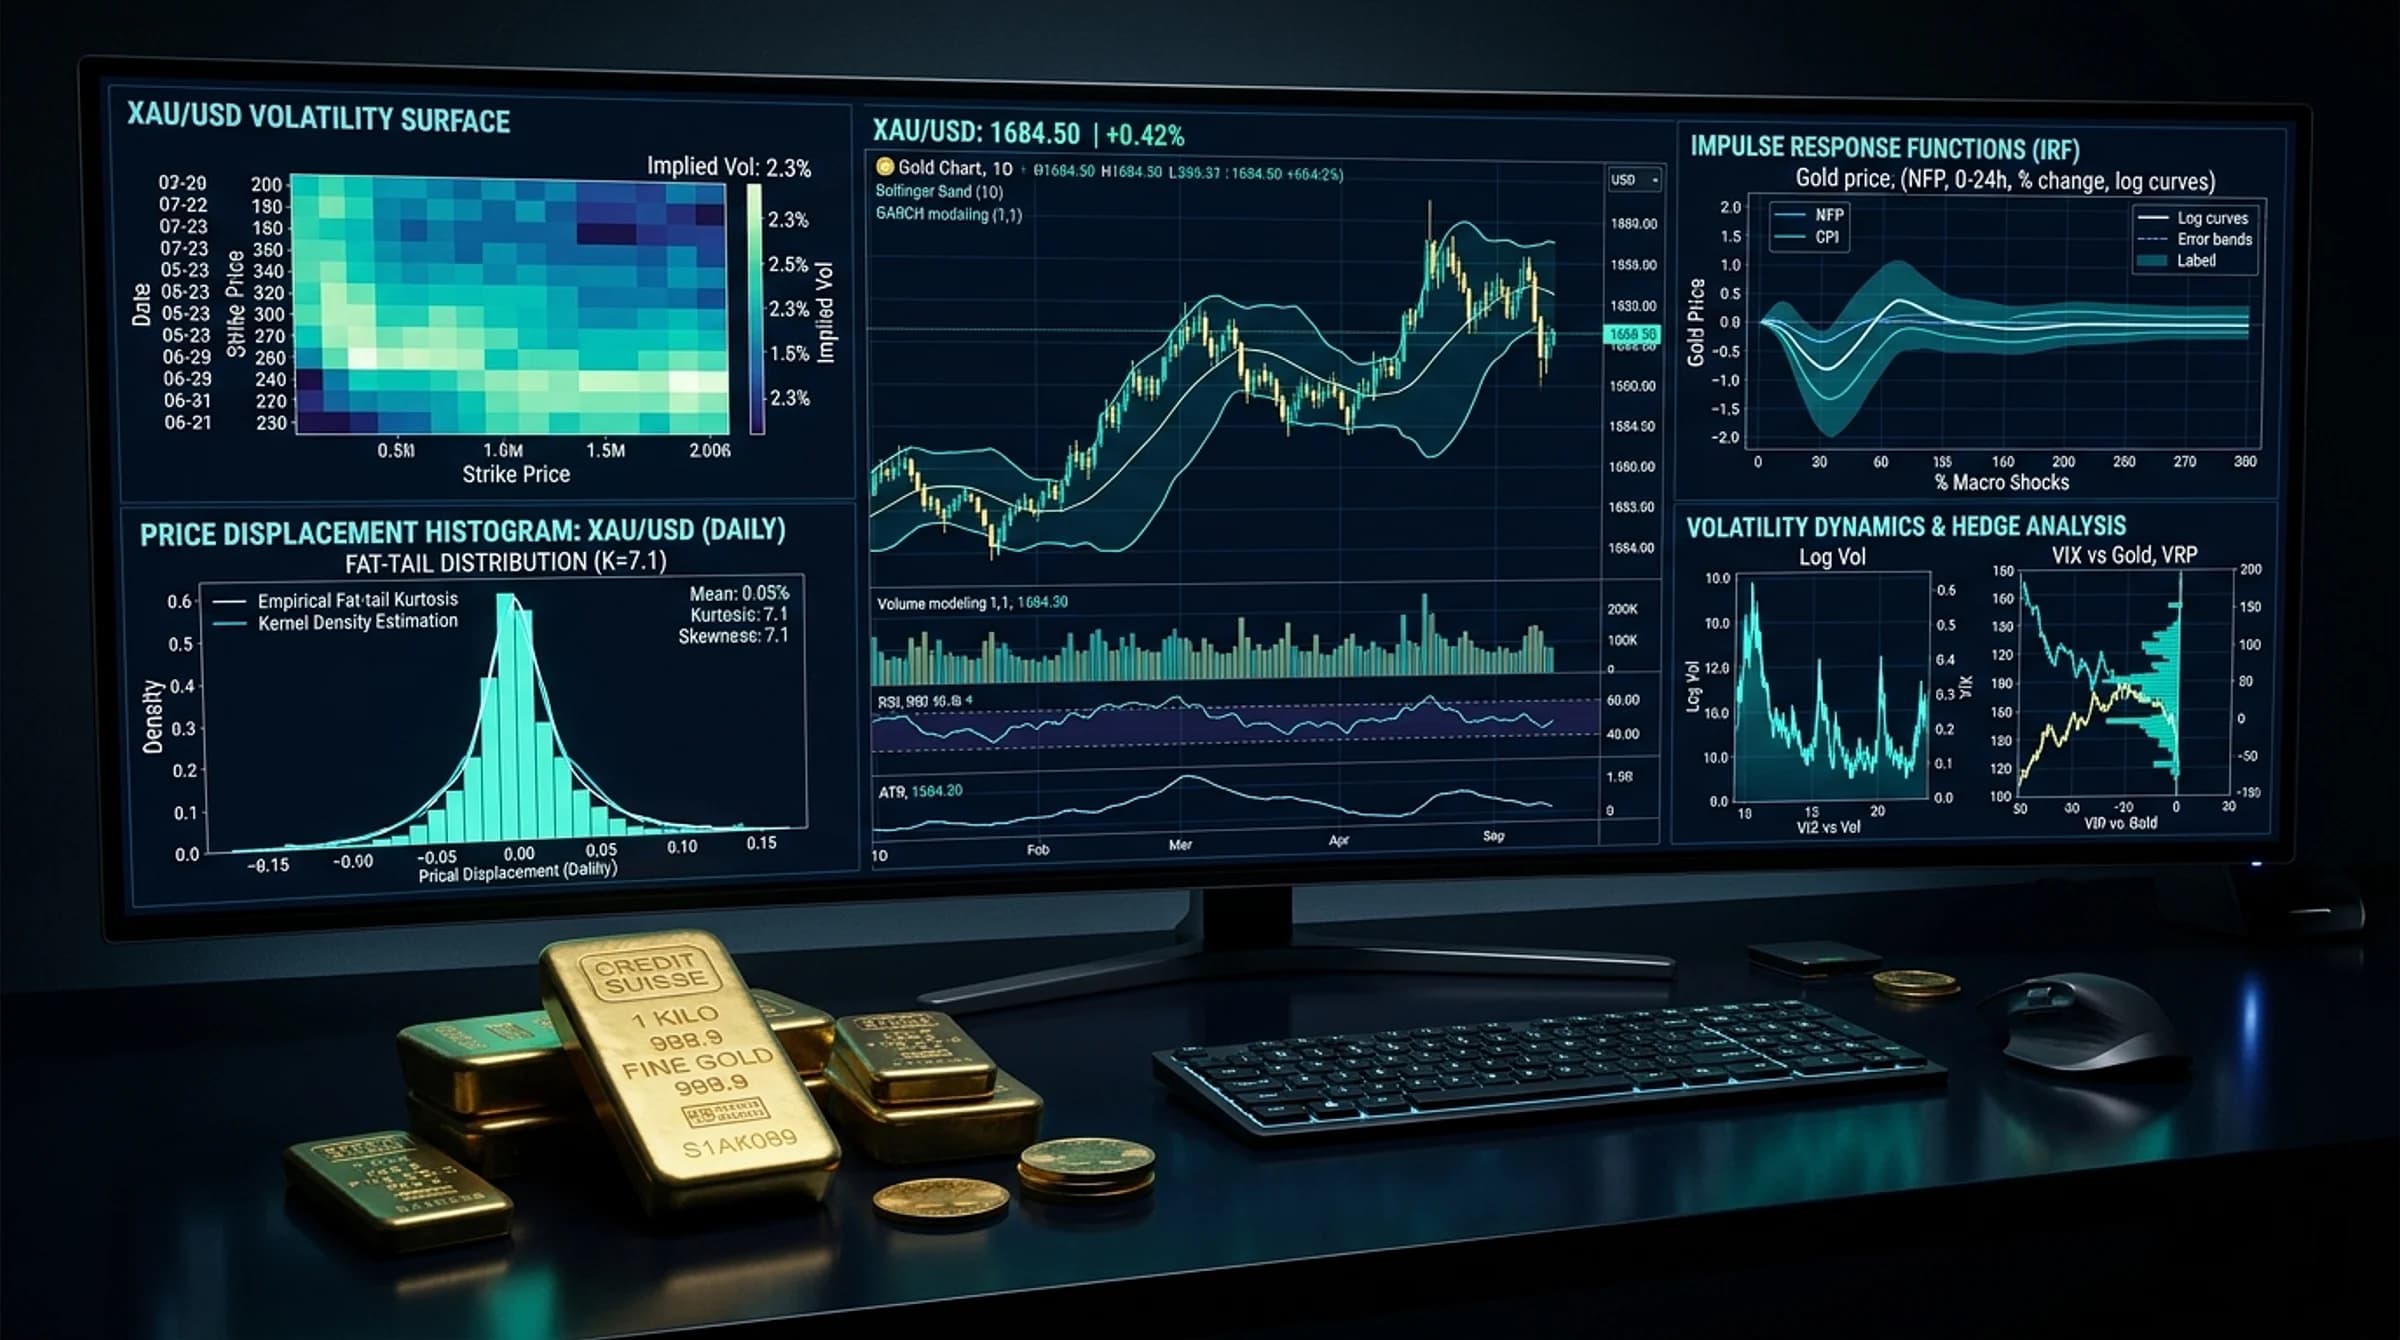
1. The Whipsaw Architecture: Order Book Mechanics at 12:30 UTC
At precisely 12:30 UTC (or 13:30 UTC during standard winter time), the US Bureau of Labor Statistics (BLS) releases two of the most influential economic data reports in world finance: - Consumer Price Index (CPI): Released monthly; measures changes in consumer prices and headline/core inflation. - Non-Farm Payrolls (NFP): Released on the first Friday of every month; measures US net job creation, the unemployment rate, and average hourly earnings.
What Happens Inside the Electronic Order Book: 60 seconds before the release, tier-1 interbank liquidity providers (JPMorgan, Citadel, Virtu, Deutsche Bank) withdraw their resting limit orders from the electronic matching engine to avoid adverse selection against algorithmic news feeds. 1. The Depth of Market (DOM) collapses to near zero. 2. The gap between the best bid and best ask explodes: standard spreads of $0.15–$0.25 widen to $2.00, $3.50, or even $5.00 per ounce. 3. High-frequency algorithmic news trading engines consume whatever sparse orders remain on the book. A modest order of 20 lots can move the market by $3.00 instantly. 4. Retail traders attempting to execute market orders during this window suffer extreme negative slippage, filling at prices far worse than displayed on their screens.
2. Historical Volatility & ATR Distribution During CPI and NFP
Quantitative examination of XAUUSD tick data across 48 monthly CPI and NFP releases establishes the following volatility parameters:
| Release Event | 1-Minute Average Range | 15-Minute Average Range | Full Session Net Displacement | Directional Follow-Through Probability |
|---|---|---|---|---|
| Core CPI (Above Consensus) | $18.00 – $35.00 (Down) | $25.00 – $48.00 | $35.00 – $65.00 | 72% (Strong Bearish Continuation) |
| Core CPI (Below Consensus) | $20.00 – $38.00 (Up) | $28.00 – $52.00 | $40.00 – $70.00 | 75% (Strong Bullish Continuation) |
| NFP (Surprise Additions > 100k) | $15.00 – $28.00 (Down) | $22.00 – $40.00 | $28.00 – $50.00 | 64% (Bearish, but prone to wage revisions) |
| NFP (Surprise Miss < 100k) | $16.00 – $30.00 (Up) | $24.00 – $42.00 | $30.00 – $55.00 | 68% (Bullish Gold Momentum) |
| Inline / Mixed Data | $12.00 – $22.00 (Whipsaw) | $15.00 – $25.00 | $10.00 – $20.00 (Mean-reverting) | < 45% (Chop & dual stop purges) |
3. The Monetary Repricing Engine: How Macro Data Moves Gold
Why does a fraction-of-a-percent deviation in CPI or employment move a physical metal by billions of dollars?
The mechanism operates entirely through Federal Reserve interest-rate expectations: 1. High Inflation / Strong Jobs: - If Core CPI or NFP prints significantly above consensus, financial markets immediately price in a more hawkish Federal Reserve. - CME FedWatch probabilities shift toward rate hikes or delayed rate cuts. - Nominal Treasury yields surge, the US Dollar Index rallies, and US 10-Year TIPS real yields spike higher. - Institutional bullion desks immediately reprice gold lower to reflect higher opportunity cost. 2. Low Inflation / Cooling Employment: - If CPI cools or the unemployment rate rises, markets price in emergency or accelerated Fed rate cuts. - Treasury yields collapse, the dollar weakens, and gold explodes higher as capital seeks real wealth preservation.
4. The Institutional NEWS_BLOCKED Protocol
At professional proprietary trading firms and quantitative hedge funds, discretionary traders are forbidden from gambling on the immediate news print.
GoldTrading.AI enforces the algorithmic NEWS_BLOCKED protocol: - Window: 15 minutes before release to 15 minutes after release (e.g., 12:15 to 12:45 UTC). - Enforcement: No new market orders or limit orders may be transmitted. - Existing Positions: Existing intraday positions must either be closed or trailing stop losses moved to locked profit. - Rationale: Attempting to predict whether CPI will print 0.1% above or below consensus is binary gambling. The risk of slippage, broker disconnection, and erratic spread spikes makes execution expectancy deeply negative during the release second.
5. The "News Retracement Model": How Institutions Actually Trade Data Drops
If you do not trade the initial news spike, how do you capitalize on the massive volatility generated by CPI or NFP?
The Answer: The Post-News Retracement Model: 1. Step 1: Observe the Initial Displacement (12:30–12:45 UTC): Allow the news release to print. Let the high-frequency algorithms fight and clear the order book. Observe whether the news creates genuine institutional displacement or a dual-sided whipsaw. 2. Step 2: Identify the Dominant Market Structure Shift (MSS): By 12:45 UTC, the market will establish a clear directional impulse wave on the 15-minute chart, breaking prior structure and leaving a wide-range Fair Value Gap. 3. Step 3: Wait for the Orderly Pullback (12:45–13:30 UTC): As the initial momentum cools, algorithms re-auction price back into the 15-minute FVG or Consequent Encroachment (50% level). Spreads return to normal ($0.15–$0.25). 4. Step 4: Execute on Mitigation: Enter in the direction of the macro news displacement at the FVG with your stop loss anchored safely behind the post-news swing extreme. 5. Step 5: Target the Macro Expansion: Target the day's external liquidity pools with a minimum 1:2.5 risk-to-reward ratio.
6. Worked Practical Trade Example: Post-CPI Retracement Short
Here is a documented execution sequence demonstrating the Post-News Retracement Model on XAUUSD:
Pre-News Conditions (12:15 UTC): - Gold trading quietly at $2,654.00. US CPI release scheduled for 12:30 UTC. - NEWS_BLOCKED protocol activated. Zero open positions.
News Event (12:30 UTC): - US Core CPI prints 0.4% MoM (Consensus was 0.2%). Significant upside inflation surprise. - Initial 1-Minute Candle: Price spikes to $2,658.00 (sweeping Asian High buy stops), then violently reverses, crashing $24.00 downward to $2,634.00 within four minutes.
Technical Formation (12:45 UTC): - The 15-minute chart prints an enormous red displacement candle closing at $2,636.00 (MSS confirmed). - An energetic 15-minute Bearish FVG forms between $2,644.00 (Candle 3 high) and $2,650.00 (Candle 1 low). Consequent Encroachment (C.E.) sits at $2,647.00.
Execution (13:10 UTC - New York Open): - At 13:10 UTC, price stages an orderly retracement into the FVG, re-testing $2,646.50 (near C.E.). - Spreads have normalized to $0.18/oz. - Entry: Sell limit filled at $2,646.50. - Stop Loss: Placed safely at $2,653.50 ($3.50 above the FVG top and below the $2,658.00 news spike high). Stop distance = $7.00. - Position Size: Account equity = $20,000 USD. 1% Risk = $200.00. Lots = $200.00 / ($7.00 × 100 oz) = 0.285 lots → Floored strictly to 0.28 lots ($196.00 actual risk). - Target: Sell-Side Liquidity resting at the weekly support low ($2,624.50). Target distance = $22.00.
Outcome: Price rejects the FVG cleanly and resumes its aggressive downward trend into the New York session, hitting $2,624.50 at 14:45 UTC. Realized profit: 0.28 lots × 100 oz × $22.00 = $616.00 USD net (1:3.14 R:R).
7. Invalidation: The "Fake News Spike" Bull Trap
What happens when economic data prints mixed signals?
The Trap Scenario: Non-Farm Payrolls prints 250,000 jobs added (stronger than the 180,000 forecast). Gold initially drops $15.00 on the headline. An aggressive trader sells the breakdown at $2,635.00. However, buried inside the report, the Unemployment Rate jumped from 3.9% to 4.2%, and Average Hourly Earnings cooled significantly.
The Reversal: 1. Macro analysts immediately recognize that the headline payroll figure was distorted by part-time government employment, while broader labor conditions are weakening. 2. Within 5 minutes, institutional buyers flood the market. The $15.00 downward drop is completely erased, and gold explodes $35.00 higher to $2,670.00. 3. The trader who sold the initial spike is caught in an immediate margin crisis.
The Rule: Never trade the immediate headline number. Major economic reports contain multiple sub-components (headline jobs, revisions, unemployment rate, hourly earnings) that can contradict each other. Wait for price action to demonstrate which component institutional capital has prioritized.