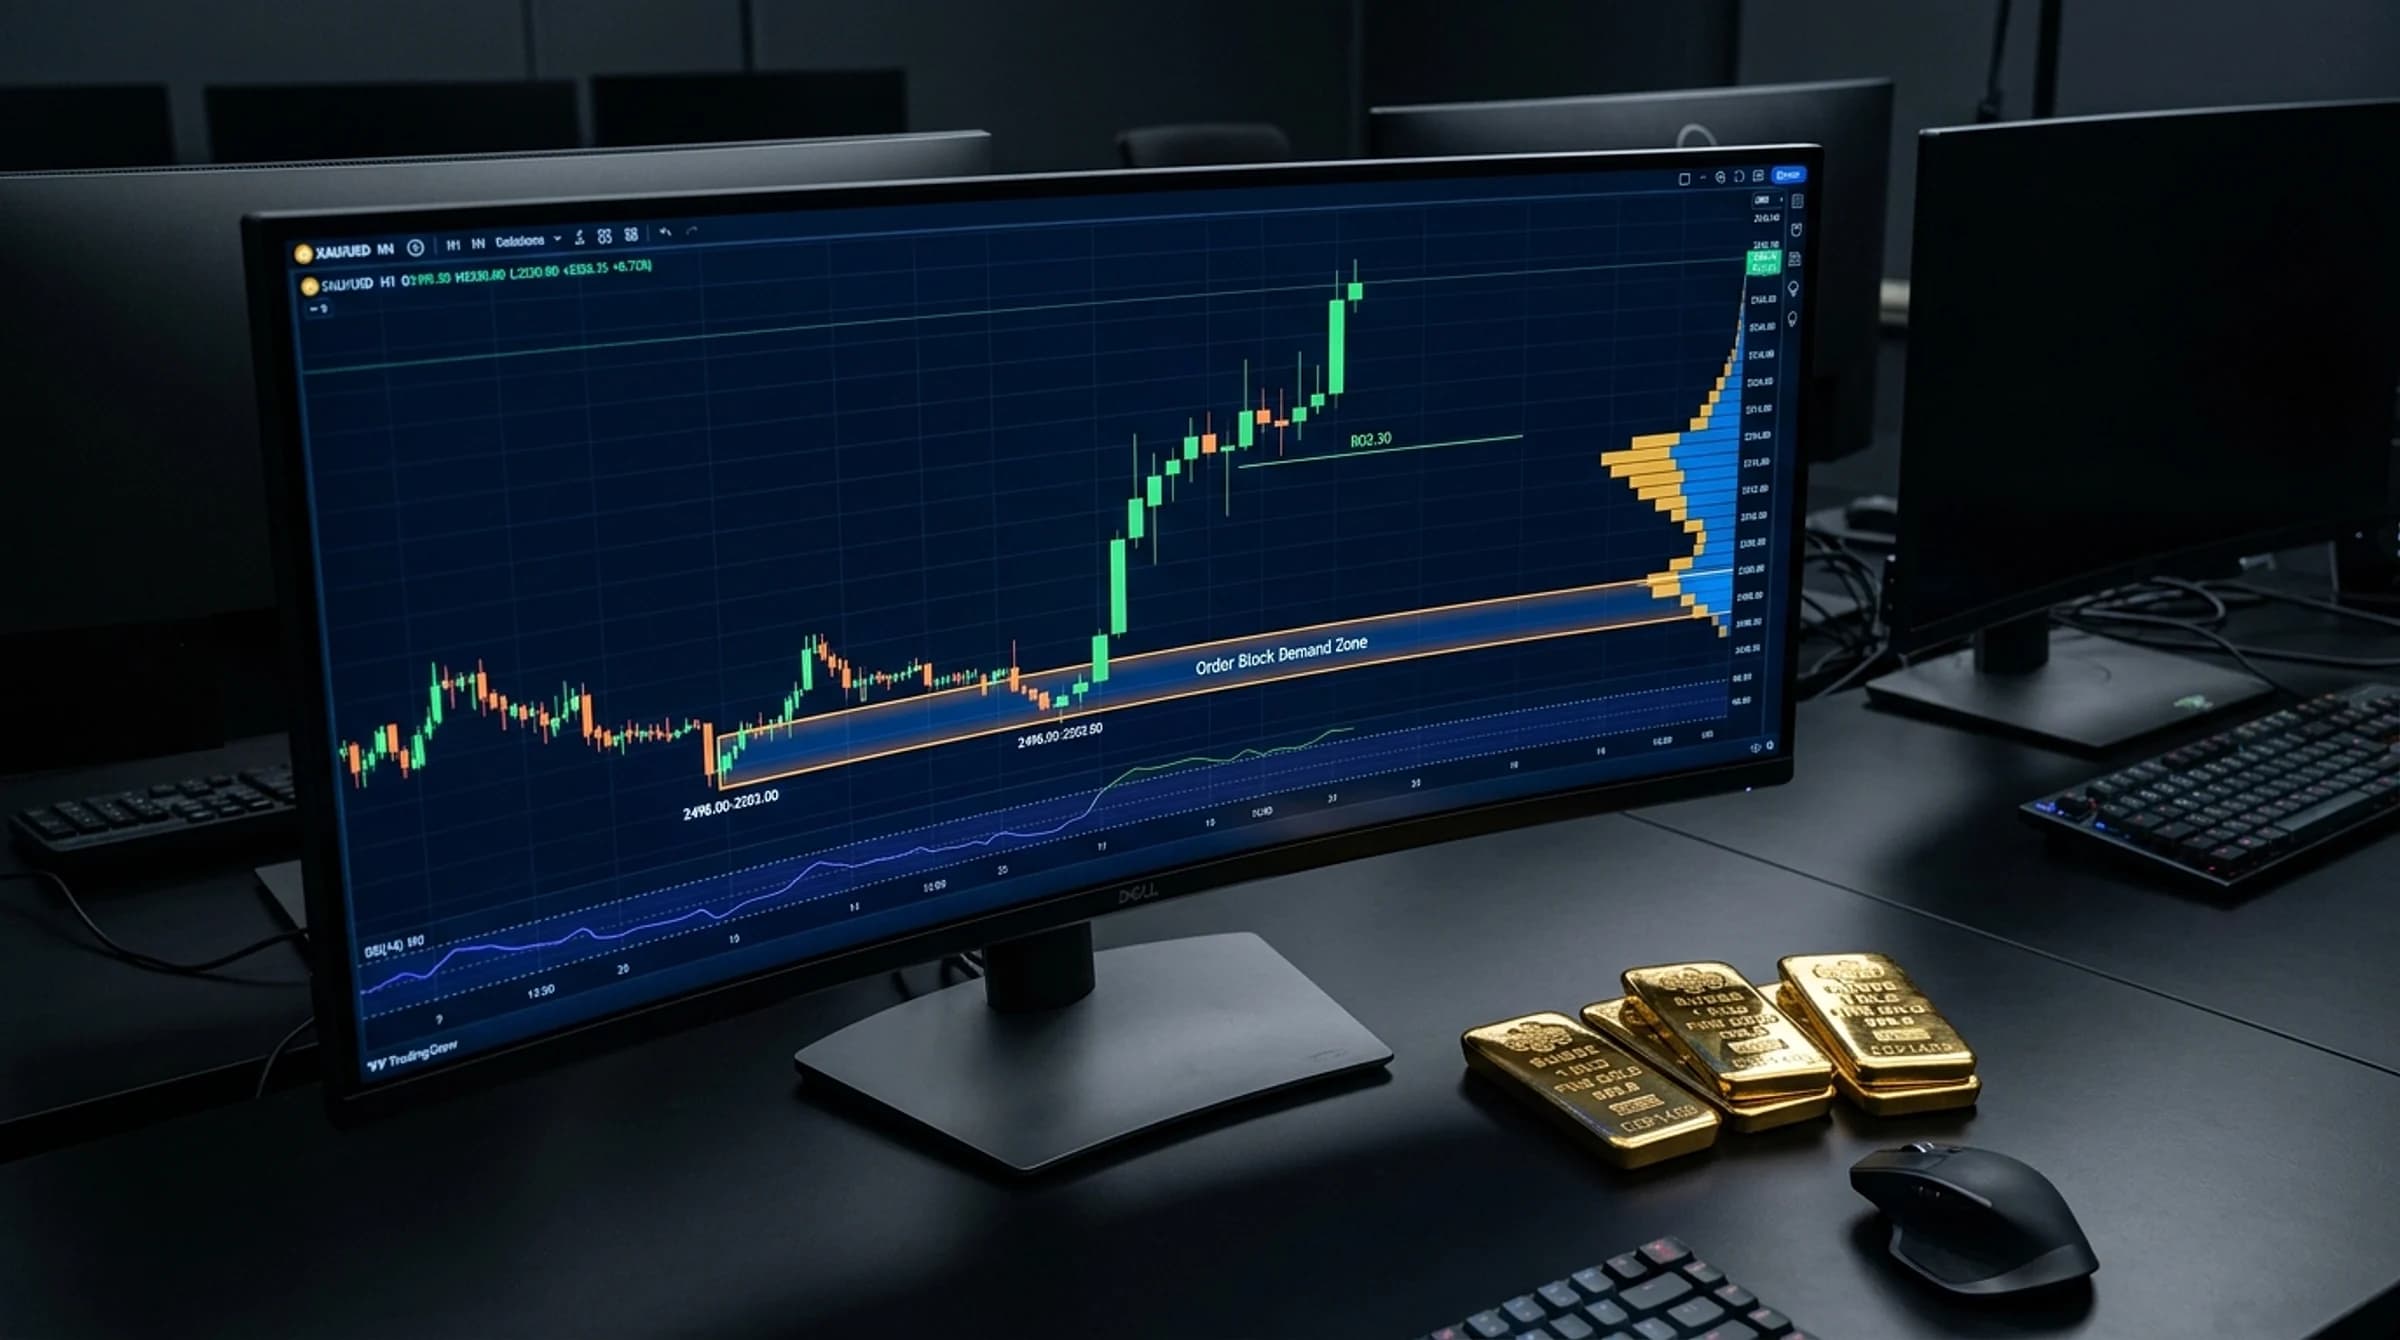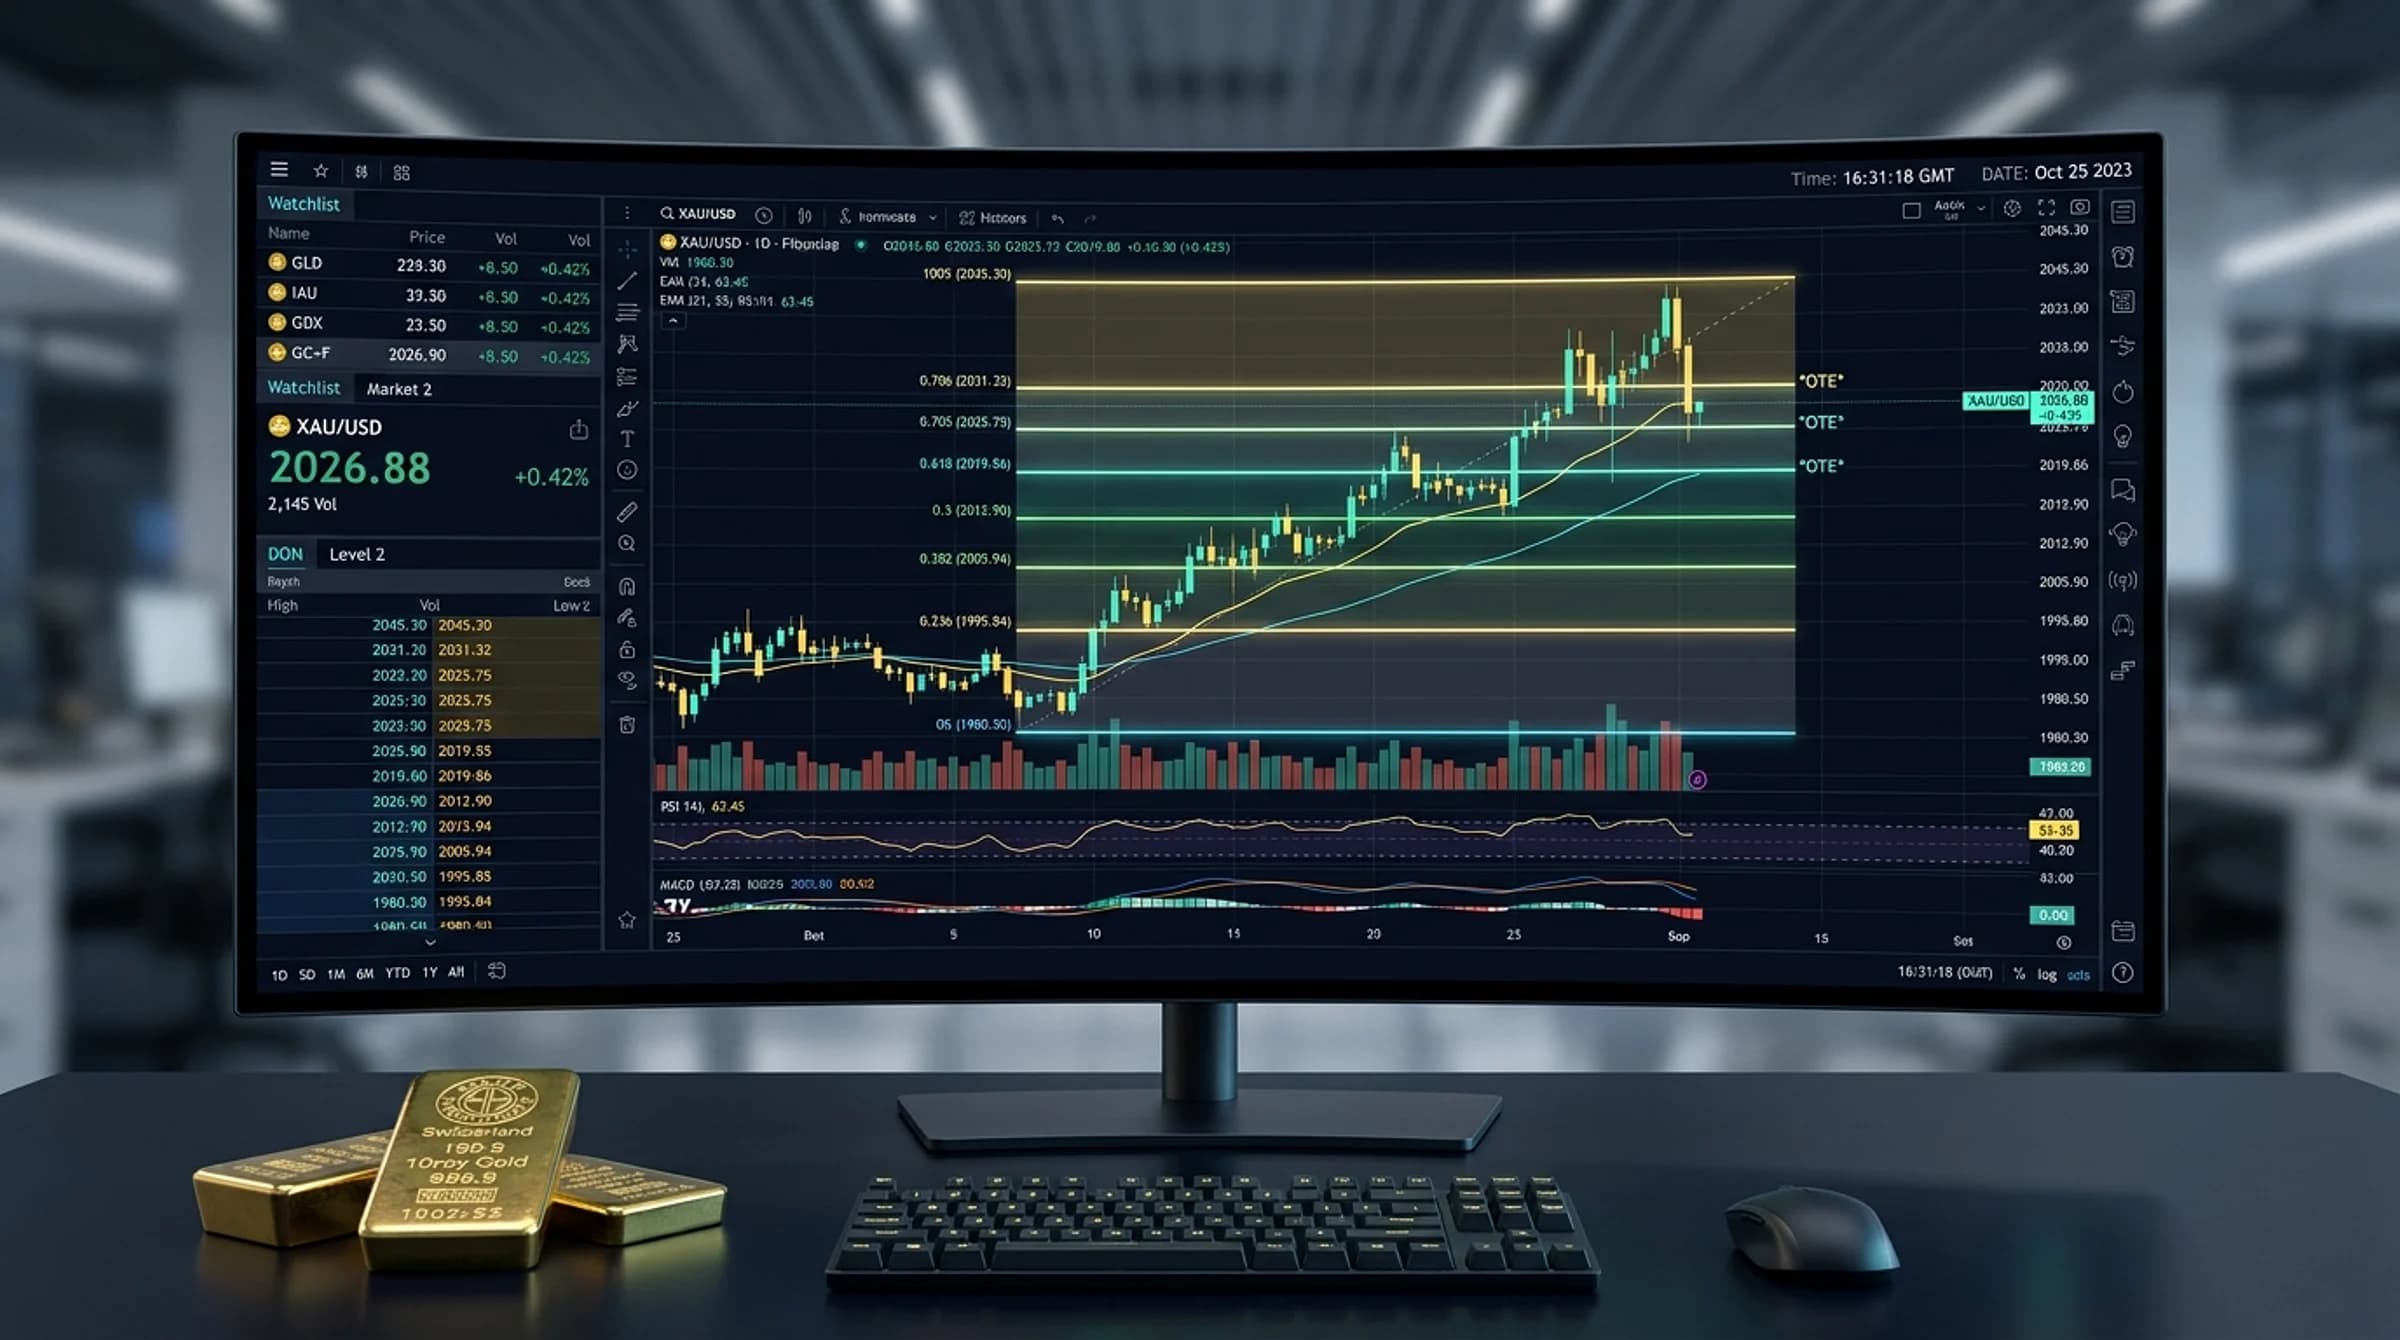
1. Anatomy of an Institutional Fair Value Gap (FVG)
In an orderly double auction, price moves incrementally, allowing both buyers and sellers to transact at every cent increment. However, when large commercial institutions inject aggressive market orders into spot gold, price expands violently in one direction.
This rapid displacement bypasses opposing resting limit orders, leaving a structural price void known as a Fair Value Gap (FVG).
The 3-Candlestick Sequence: - Bullish FVG (BISI - Buy-Side Imbalance, Sell-Side Inefficiency): Formed by three consecutive candlesticks where Candle 2 is an aggressive upward expansion candle. The gap exists between the high of Candle 1 and the low of Candle 3. In this price corridor, only buyers were matched; sellers were completely shut out of the auction. - Bearish FVG (SIBI - Sell-Side Imbalance, Buy-Side Inefficiency): Formed when Candle 2 plunges downward. The gap exists between the low of Candle 1 and the high of Candle 3. In this corridor, only aggressive sell orders transacted.
Why Gold Algorithms Return to FVGs: Electronic market matching engines are programmed to maintain orderly markets. When an aggressive displacement leaves a one-sided liquidity void, algorithms routinely re-auction price back into the imbalance to offer two-sided liquidity before continuing the broader structural trend.
2. Consequent Encroachment (C.E.) and the 50% Rule
Not all price levels inside a Fair Value Gap are equally significant. The most critical price benchmark is the exact mathematical midpoint, known as Consequent Encroachment (C.E.):
For Bullish FVG: Consequent Encroachment = Candle 1 High + [(Candle 3 Low − Candle 1 High) × 0.50]
For Bearish FVG: Consequent Encroachment = Candle 3 High + [(Candle 1 Low − Candle 3 High) × 0.50]
The Candle Body Respect Rule: When gold retraces into an FVG, institutional algorithms frequently probe the C.E. level. - A high-probability reaction occurs when price wicks down into or slightly past C.E. but the candlestick body closes above C.E. (for a bullish setup). - If a candle body closes decisively below Consequent Encroachment, the imbalance is considered compromised, indicating that institutional buyers are absent.
Consequent Encroachment (C.E.) = Lower Boundary + [(Upper Boundary − Lower Boundary) × 0.50]3. Distinguishing True FVGs from Volume Imbalances & Gaps
Traders must categorize different types of price voids on gold charts:
1. True Fair Value Gap (FVG): A wide, clear gap between the wicks of Candle 1 and Candle 3. This represents substantial institutional displacement and provides the highest statistical confluence for pullback trades.
2. Volume Imbalance (VI): Occurs when the wicks of Candle 1 and Candle 3 overlap, but their real candlestick bodies do not touch (leaving an open space between the closing price of Candle 1 and the opening price of Candle 2). While weaker than a full FVG, Volume Imbalances frequently act as sensitive intraday support/resistance pivots.
3. Common Opening Gap: Occurs between Friday market close (21:00 UTC) and Sunday market open (22:00 UTC). Opening gaps are structural delivery discontinuities caused by closed exchange hours rather than continuous electronic displacement.
| Void Type | Candle Structure | Market Velocity | Reliability on XAUUSD |
|---|---|---|---|
| True FVG (BISI/SIBI) | Wicks of Candle 1 and 3 do not overlap | High institutional displacement | High (Primary entry mechanism) |
| Volume Imbalance | Wicks overlap, candle bodies do not | Moderate momentum | Moderate (Secondary retest zone) |
| Opening Weekend Gap | Blank space between Friday close and Sunday open | Interbank weekend headline shock | Unreliable (Gap fill not guaranteed) |
4. Inversion Fair Value Gaps (IFVG): When Imbalance Flips
A powerful evolution of the Fair Value Gap is the Inversion Fair Value Gap (IFVG).
What Happens When an FVG Fails? Suppose a Bullish FVG forms between $2,648.00 and $2,652.00 during the European session. You expect price to retrace and bounce from this zone. However, an aggressive US news release hits, and price crashes straight through the gap without slowing down, closing a 15-minute candle body well below $2,648.00.
The Inversion Principle: That failed Bullish FVG does not disappear; it immediately inverts into a Bearish Inversion Fair Value Gap. When price subsequently rallies back upward into the $2,648.00–$2,652.00 zone, the former buy-side imbalance now acts as institutional overhead resistance. The market participants who were trapped on the long side use the retracement to exit at breakeven, while aggressive short algorithms add new sell orders.
6. Worked Practical Trade Example: Discount FVG Long on M15
Here is a step-by-step institutional trade setup executed on a 15-minute XAUUSD chart:
Context & Setup (08:15 UTC - London Kill Zone): - Daily trend is bullish. The London Open swept the Asian session low ($2,640.00), probing down to $2,637.20. - Price violently displaced upward, breaking market structure above $2,644.00 with a wide-range green candle. - A 15-minute Bullish FVG formed: Candle 1 High = $2,641.50 | Candle 3 Low = $2,645.50. - Gap Size = $4.00 ($400 points). Consequent Encroachment (C.E.) = $2,643.50. - Equilibrium check: The dealing range is $2,637.20 to $2,650.00 (Equilibrium = $2,643.60). The FVG sits perfectly in the discount zone.
Execution Plan: - Entry: Buy Limit placed at $2,644.50 (just inside the FVG top) with a second add order at C.E. ($2,643.50). Average entry = $2,644.00. - Stop Loss: Anchored below the displacement swing low at $2,639.50. Stop distance = $4.50. - Position Sizing: Account equity = $10,000 USD. 1% Risk = $100.00. Lots = $100.00 / ($4.50 × 100 oz) = 0.222 lots → Floored strictly to 0.22 lots ($99.00 actual risk). - Take Profit Target: Resting Buy-Side Liquidity at the previous day high ($2,658.00). Target distance = $14.00.
Trade Progression: At 08:45 UTC, price pulls back into the gap, wicks down to $2,643.20 (testing C.E.), and prints a bullish rejection candle closing at $2,645.80. Over the next 90 minutes, gold expands steadily into New York, reaching the $2,658.00 target for a realized profit of $308.00 USD (1:3.11 R:R).
7. Invalidation Scenario: When an FVG Fails to Hold
Every trader must recognize when an FVG setup has failed:
The Setup: You identify a 5-minute Bullish FVG on gold between $2,654.00 and $2,657.00. You enter long at $2,655.50 with a stop loss below the origin candle at $2,651.00 ($4.50 risk).
The Invalidation: Instead of reacting from Consequent Encroachment ($2,655.50), price slices cleanly through the lower boundary ($2,654.00). The subsequent 5-minute candle closes at $2,652.50—completely outside the gap.
Why It Failed: 1. Higher Timeframe Alignment: The 4-Hour chart was testing a major bearish Order Block at $2,660.00. The 5-minute FVG was merely a low-timeframe pullback within a higher-timeframe sell program. 2. Volume Absorption: Institutional sell volume completely absorbed retail buy orders resting inside the FVG. 3. Action: The moment a candle body closes outside the FVG in counter-trend direction, the trade is invalidated. Accept the predefined 1% stop loss without hesitation.