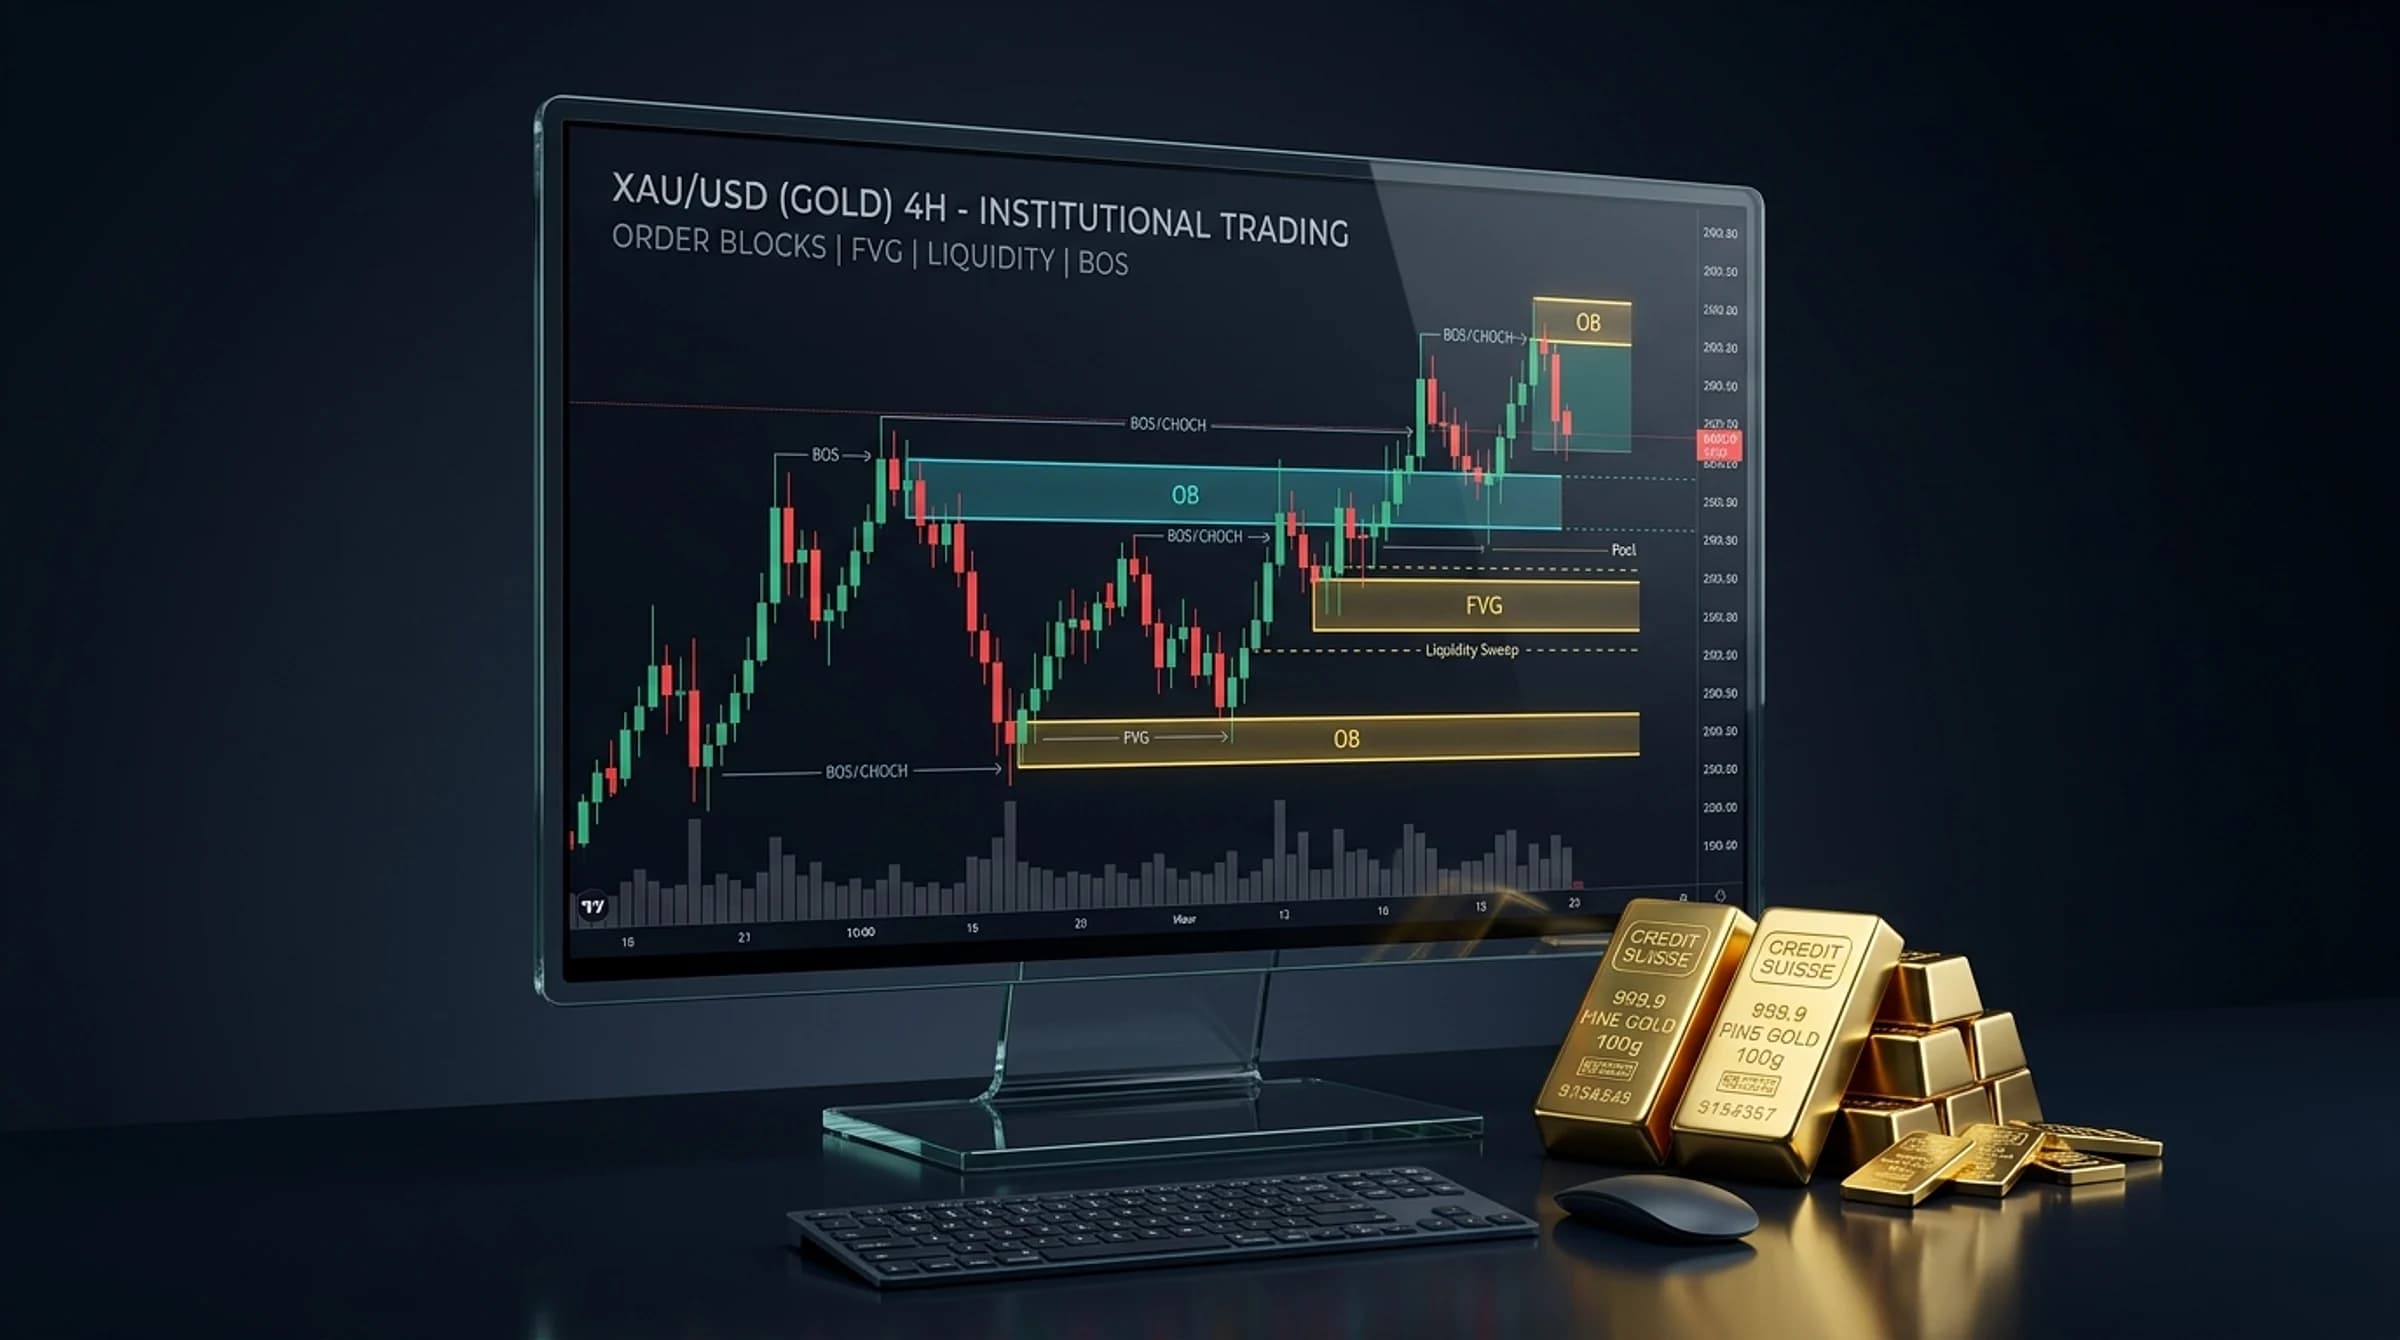
1. The Mechanics of a Liquidity Sweep: Why Stop Runs Occur
In the gold market, liquidity sweeps—colloquially termed "stop runs" or "stop hunts"—are not random glitches or broker manipulation directed at individual retail accounts. They are the mathematical consequence of electronic matching engines filling large institutional orders.
Why Wholesale Desks Need Liquidity Sweeps: If a large hedge fund or bullion desk attempts to buy 500 standard lots of XAUUSD ($130+ million notional) at market price during a quiet session, their own buy orders will consume all available resting sell limits on the book, driving price up by $5.00 to $10.00 and inflicting massive slippage.
To avoid this, the institutional algorithm waits for price to approach an obvious technical level where retail orders are clustered—such as the Asian session low or a 4-hour double bottom. 1. Directly below these lows rests a concentrated pool of Sell-Side Liquidity (SSL), consisting of retail sell stop-losses and breakout sell-stop orders. 2. The algorithm pushes price just 10 to 30 cents below the low, triggering the flood of market sell orders. 3. The institution fills their massive buy limit orders directly against this panicked retail selling. 4. With selling exhausted and institutional buying absorbing all volume, price reverses violently back into the range.
2. Internal vs. External Range Liquidity (IRL / ERL)
Professional gold traders structure their charts around the continuous cycle between Internal and External Range Liquidity:
- External Range Liquidity (ERL): Major structural highs and lows—Previous Day High (PDH), Previous Day Low (PDL), Asian High/Low, Previous Week High/Low (PWH/PWL). These levels mark the outer boundaries of the current dealing range. - Internal Range Liquidity (IRL): Inefficiencies residing inside the range—Fair Value Gaps, Volume Imbalances, and Order Blocks.
The Delivery Cycle: 1. Price expands to sweep External Range Liquidity (e.g., purging PDH). 2. Having harvested liquidity, the market rotates inward toward Internal Range Liquidity (re-balancing a discount FVG). 3. Once the internal inefficiency is mitigated, price accelerates outward toward the opposing External Range Liquidity pool (purging PDL). Understanding this rhythm prevents traders from buying into external highs or shorting into external lows.
3. The Turtle Soup Reversal Execution Model
The "Turtle Soup" pattern, originally formalized by legendary traders Laurence Connors and Linda Raschke, is the premier tactical strategy for trading liquidity sweeps:
Execution Rules for Turtle Soup Plus One: 1. Benchmark Level: Identify a key swing high or low that has stood for at least 20 trading sessions or represents the high/low of a major trading session (Asia, London, or Previous Day). 2. The Sweep: Price breaches the benchmark level by $0.50 to $3.00, triggering breakout stops. 3. The Rejection: Within 1 to 3 candlesticks, price fails to maintain momentum and closes back inside the original range. The candle prints an extended rejection wick. 4. Entry Trigger: Enter a counter-trend position as price crosses back below the benchmark high (for a short) or back above the benchmark low (for a long). 5. Stop Loss Placement: Place the stop loss 50 cents to $1.00 beyond the extreme tip of the sweep wick. 6. Target: The opposing liquidity pool (e.g., if sweeping Asian Low, target the Asian High).
4. Equal Highs (EQH) and Equal Lows (EQL): Retail Liquidity Traps
When retail technical analysis sees "double tops" or "double bottoms," classical textbooks teach traders that these levels represent solid resistance or support.
To an institutional algorithm, Equal Highs (EQH) and Equal Lows (EQL) represent an irresistible feast of resting liquidity. - Every time price touches a resistance level and pulls back, retail traders place fresh stop-losses just above that resistance. - The cleaner and more obvious the double or triple top appears, the denser the liquidity pool becomes. - Smart money algorithms regularly engineer an energetic thrust directly through EQH or EQL to sweep the accumulated stop pool before executing true directional turns. Never place a stop loss directly at an equal high or low; that is precisely where algorithmic liquidity harvesting occurs.
| Chart Pattern | Retail Interpretation | Institutional Algorithmic Reality | Strategic Action |
|---|---|---|---|
| Double Top (EQH) | Strong resistance; prepare to sell | Dense cluster of Buy Stops; prime sweep target | Wait for sweep above EQH, then short on MSS |
| Double Bottom (EQL) | Strong support; prepare to buy | Dense cluster of Sell Stops; prime sweep target | Wait for sweep below EQL, then buy on MSS |
| Trendline Support | Reliable trend continuation line | Stacked stop losses beneath trendline touches | Anticipate sharp liquidation sweep through trendline |
5. Worked Practical Trade Example: Asian Low Liquidity Sweep
Here is a complete trade walkthrough demonstrating a Turtle Soup long execution on XAUUSD:
Setup Context (07:20 UTC - London Open): - Asian Session Range: High = $2,656.00 | Low = $2,644.00. - Daily bias is bullish. At 07:25 UTC, London banks trigger an aggressive sell wave that pushes gold down through the Asian Low ($2,644.00), bottoming at $2,641.80. - The 5-minute candle at 07:30 UTC prints a long lower wick and closes back inside the Asian range at $2,645.20.
Confirmation & Entry: - The 07:35 UTC 5-minute candle breaks market structure above $2,646.00 with a green displacement candle, creating a 5M Fair Value Gap at $2,644.50. - Entry: Buy limit filled on retest of $2,644.80. - Stop Loss: Placed at $2,640.80 ($1.00 below the sweep extreme of $2,641.80). Stop distance = $4.00. - Position Sizing: Account equity = $10,000 USD. 1% Risk = $100.00. Lots = $100.00 / ($4.00 × 100 oz) = 0.25 lots. - Target: Asian High ($2,656.00). Target distance = $11.20 ($1,120 points).
Outcome: Price holds the FVG, rejects cleanly, and expands steadily upward throughout the London session, reaching $2,656.00 at 09:45 UTC. Realized gain = 0.25 lots × 100 oz × $11.20 = $280.00 USD (1:2.80 R:R).
6. Invalidation: Distinguishing Real Sweeps from True Breakouts
The critical danger in trading liquidity sweeps is stepping in front of a genuine institutional breakout:
The Trap: You attempt to short gold because price poked above the previous day high at $2,660.00, assuming it is a "sweep." You sell at $2,661.00 with a stop loss at $2,664.00.
The True Breakout Sign: Instead of leaving an extended wick and closing back inside the range, the 15-minute candle closes with a thick, energetic green body at $2,665.00, followed by another green candle closing at $2,670.00 with a large FVG.
Validation Checklist: How to Know It Is NOT a Sweep: 1. Candle Body Close: If the candle body closes outside the level with more than 60% of its range past the boundary, it is a genuine Break of Structure (BOS), NOT a sweep. 2. Volume Momentum: If tick volume expands 300%+ and consecutive candles print zero lower wicks, institutional capital is driving a real expansion. 3. Immediate Invalidation: If price closes a full candle body beyond your sweep level, exit immediately. Never fight real institutional expansion.